Getting started with Spectrum Analysis using Wi-Spy and Chanalyzer
16/10/2013 Written by Pranay Pancholi at Loughborough University, WTAS adviser
Wireless networks share the 2.4GHz and 5GHz spectrums along with a variety of other interfering devices. By conducting a Spectrum Analysis, IT administrators can quickly identify and troubleshoot common sources of interference of their local RF environment in Wi-Fi (802.11 a/b/g/n) networks.
Example: maybe you have a device such as a laptop or tablet that is within an excellent signal area but it has very poor connectivity. This is often caused by other wireless devices using the same RF as Wi-Fi networks, causing the occurrence of dead spots and dropouts. Here are a few common devices that can cause dead spots in an area even if an AP is nearby:
- Console Controllers
- Microwave Ovens
- Wireless CCTV
- Baby Monitors
- Cordless DECT Phones
- Analog/Video Transmitters
This document will help user to understand the basic procedures of getting started in undertaking a Spectrum Analysis scan of troublesome hotspot locations by using MetaGeek’s Wi-Spy DBx tool with Chanalyzer Pro and Chanalyzer for Mac OS X.
Using Wi-Spy DBx with Chanalyzer Pro
Wi-Spy DBx device is a portable USB Wi-Fi spectrum analyzer which displays RF in the 2.4GHz and 5GHz open spectrums. This device lets you capture non Wi-Fi activity that can be emitted from devices that can affect the wireless spectrum, such as those mentioned above. The results of interference are interpreted by using Chanalyzer Pro software.
Installation of the Chanalyzer Pro is relatively simple. System requirements are Microsoft Windows 7, Vista, XP (with SP3) and with .Net framework installed. A USB port must exist in order to connect the bundled Wi-Spy DBx module. You can also download Chanalyzer for Mac (Mac OSX 10.7 or greater only) and use the same USB module provided, although the results are limited in comparison to the Windows version.
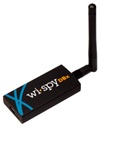
In order to use Chanalyzer the Wi-Spy DBx USB module must be inserted into your desktop/laptop machine first. During launch of the application it will instantly start scanning the RF spectrum for any signs of interference.
Once you start the application you can see from the image below you are presented with three main viewing panes.
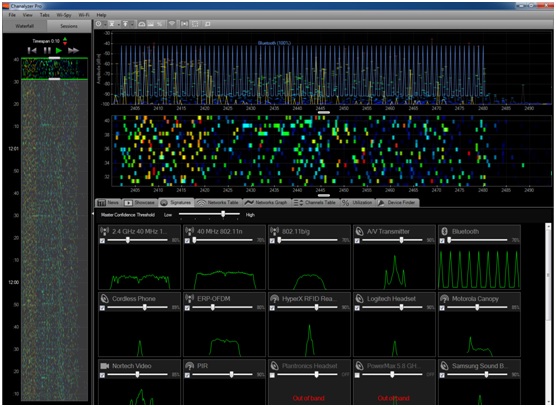
On the left hand side of the screen you are presented with your timeline. This is displayed as a waterfall where you can see a series of time stamps or it can also be viewed as sessions that were saved from previous captures.
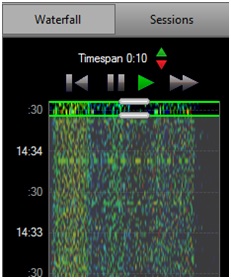

When starting Chanalyzer the default timespan is set to 2 minutes. In this example, within the first 30 seconds of starting the application, Chanalyzer will display the overall density of 2 minutes. Clicking on the green and red arrows on the left hand side pane can modify this.
The top half viewing pane display is your overall overview that displays the amplitude - this is known as the duty cycle. It displays how continuous the RF frequency is across your Wi-Fi channels.
The sweeping spectrum known as the waterfall view is shown directly underneath the amplitude/duty cycle window. This illustrates the RF activity as a waterfall, over a set timeframe that has been set by modifying the timespan shown above. You are also able to select an earlier time from the timeline window on the left hand side of the application screen.
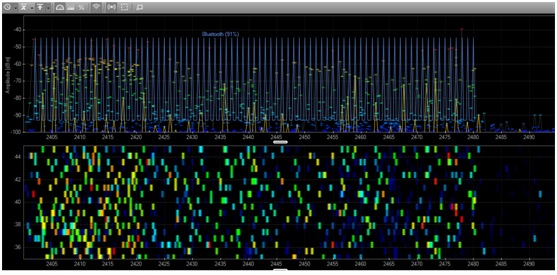
By default Wi-Fi channels are displayed as frequencies. This can be changed to show channels by clicking View on the Menu Bar followed by Wi-Fi channels. The X axis will now change from displaying frequencies to channel numbers.
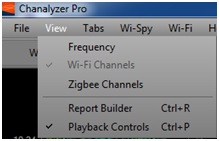
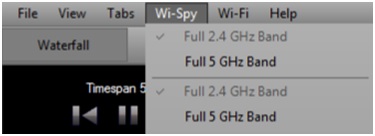
As this is a 2.4GHz and 5GHz spectrum analyser you can easily switch between the two bands by selecting Wi-Spy from the menu bar followed by selecting a band. From the list you can also select an individual channel if required for more in-depth channel analysis.
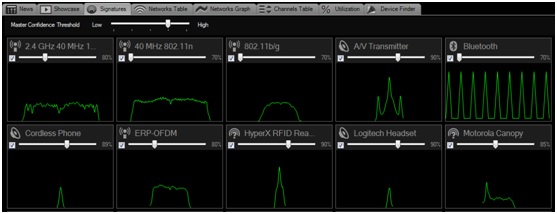
The bottom half viewing of the screen displays additional details, graphs and overlays of interference signatures, network graphs and tables, device finder and utilization. By selecting the Signatures’ tab it is recommended to select all items that can cause interference. By doing so, if Chanalyzer detects a form of interference it will be displayed as a blue overlay on the amplitude section of the main window.
The screenshot below shows the Wi-Fi environment from an open plan office space that has three wireless access points. As the Bluetooth pattern signature is enabled from the Signatures tab above you can see below that there is a strong presence of Bluetooth across all channels 1-13.

Another example seen is when a Microwave oven close to an access point is turned on. You can see below this affects the entire spectrum across all channels. Microwave ovens tend to affect the full frequency ranges and as you can see on the timestamps the interference lasted for one minute in this waterfall view. As you can see on channel 11 there is a strong red colour, which indicates a high level of noise that is affecting that channel. This disappears as soon as the Microwave oven has been turned off.

Chanalyzer for Mac OS X
Chanalyzer for Mac is a native application supported on OS X which provides colourful views of the RF spectrum to provide basic spectrum analysis functionality. To view the RF spectrum within the application, the Wi-Spy DBx USB module must be inserted to your Apple Mac desktop or laptop. The software can be downloaded from: http://www.metageek.net/products/chanalyzer-mac/
The OS X version of Chanalyzer allows users to:
- View Wi-Fi network table.
- Monitor and locate sources of real time interference.
- Scan 2.4GHz and 5GHz.
- View Waterfall mode.
- View 3D Spectrogram data.
- Save recordings of Wi-Fi Spectrum.
- Apply markers.
To use Chanalyzer for Mac first download and install the software from the above link. Next, enable the built in Wi-Fi network to allow for viewing existing networks.
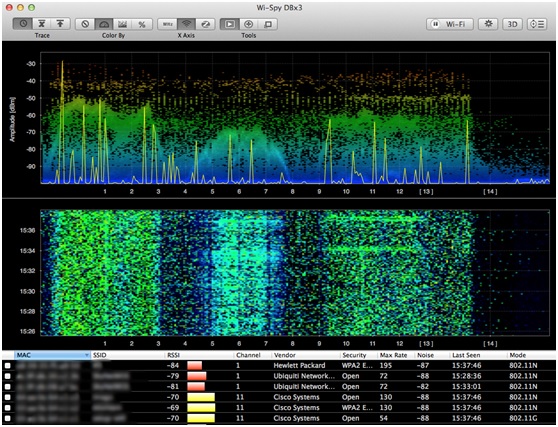
The screenshot above is currently set scanning on the 2.4GHz. Just like the Windows’ variant you can see the Amplitude/duty cycle on the top section of the application; the middle section displays the spectrum waterfall. The bottom section of the application displays the Wi-Fi network table that shows a list of available networks. For security reasons the Mac Address and SSID details have been blurred out. One disadvantage is that the navigational section pane does not exist – this is available in the Windows-only Pro version, representing the full captured analysis, which users can save and view and navigate through different timestamps.

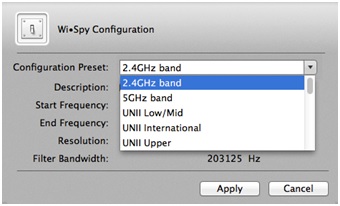
Chanalyzer for Mac supports analysis for both 2.4GHz and 5GHz spectrums. This can be changed at anytime by clicking on the gear icon on the top right set of icons.
The Wi-Spy configuration window will pop up allowing you to choose which channel band you wish to analyse. Upon your selection any previous captured analysis will be lost. For the examples within this document it has been set to capture using the 2.4GHz band.
Chanalyzer for Mac also consists of a 3D Spectrogram, a feature that gives you a 3D presentation of your amplitude of your interface environment. This can be displayed by clicking on the 3D button from the top right set of icons.
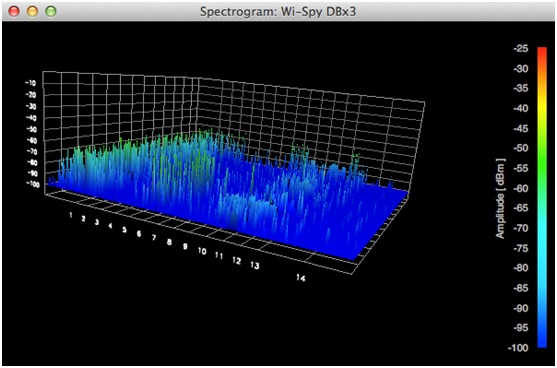
The result in identifying interference is similar to the Windows’ variant but without the overlay of having any signatures placed on the screen to match the amplitude patterns. The screenshot below shows the result of a microwave oven turned on and you can see that the amplitude levels across all channels in the 2.4GHz band are heavily utilized. This can cause dropouts.

The sweep spectrogram below also illustrates the interference caused by the microwave oven. This lasted for a short period of time - under a minute. The interference can be seen by the green line at time 19:50 affecting through all channels. The sweep spectrogram captures data and is displayed in 5 minute intervals as seen in the timeline on the left hand side. Unlike the Windows’ variant there is no option to reduce the timespan, which would give you a less condensed illustration.

The marker feature on the Mac is a useful feature for location tracking an area of interference that can be tagged using the application, which allows monitoring of a specific frequency in real time. This allows you to walk with your laptop and get closer to the interfering source. To use markers from the top right row of icons, select the marker icon and a Markers window will appear.

Next, to tag a marked point, click the plus button on the list of tools buttons.

The cursor will change to a red line, which you can place and click over your amplitude/duty cycle section of the window and a colour coded reading will be placed in the Markers window. You can have multiple tags selected and they will all be displayed on the Markers window as seen below.

Summary
Chanalyzer Pro and Chanalyzer for Mac provide administrators with a quick and easy method of Wi-Fi troubleshooting. With both applications you are successfully able to track down interfering sources using the simplistic software configuration. Chanalyzer for Mac makes an excellent addition to the limited number of available OS X supported Wi-Fi applications that are currently present however it does miss some of Chanalyzer Pro’s main functionality which is only supported on Windows platform. Although Chanalyzer for Mac can be downloaded at no cost, a Wi-Spy DBx module must be purchased.


Comments
Great article! Many an hour can be saved by just checking the environment for interference.
That last screenie is worth extra comment, I think. It shows (I believe) the side-lobes produced from a strong 2.4GHz transmission. These clearly increase noise in neighbouring channels when very close to a transmitter. It's always worth turning off the NIC in your laptop when doing any spec' analysis, else the source of crazy interference you're tracking could just be...you :)